
One you know WHAT you want to measure (i.e. which KPIs to use), you need to decide based on what parameters you would like to analyse them
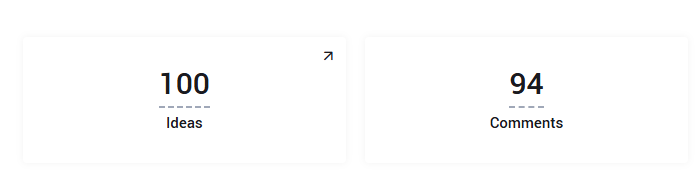
When no grouping is selected, the report dashboard will display the total/overall number (based on the selected filters):
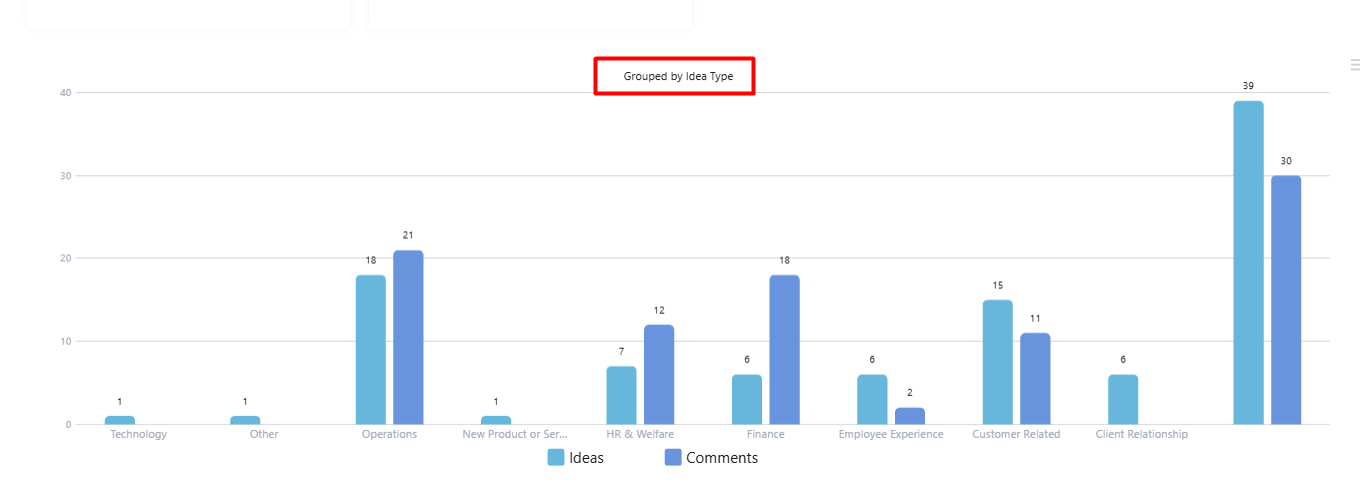
One grouping is defined, the selected grouping is displayed above the chart/table.
The basic grouping and filtering options are:
- By the campaign/tenant the ideas/entities belong to
- By the acting user itself, or by any of his/hers profile information.
Note:
The grouping by user can refer to the user's activities (as the ideas he/she submitted, the rating he/she did, the comments he/she added, the tasks he/she executed, but also by looking at the feedback the content that the user submitted received - either by gamification point, or by feedback from other users. For example: how many time ideas of specific users were adopted. - By any of the ideas/entity's categorization
- By when content was submitted and/or progressed along the workflow
- By current state (similar to the way we group ideas in the funnel report)
- By moderation decisions
- And more.
General note:
When filtering/grouping entities that are features side-by-side with ideas/projects and filtering grouping by campaigns/states etc, the features should be filtered according to the segmentation of the parent.
In addition, there is an option to determine what grouping methods to use.
The 3 grouping methods are:
- Single grouping of one or more KPIs.
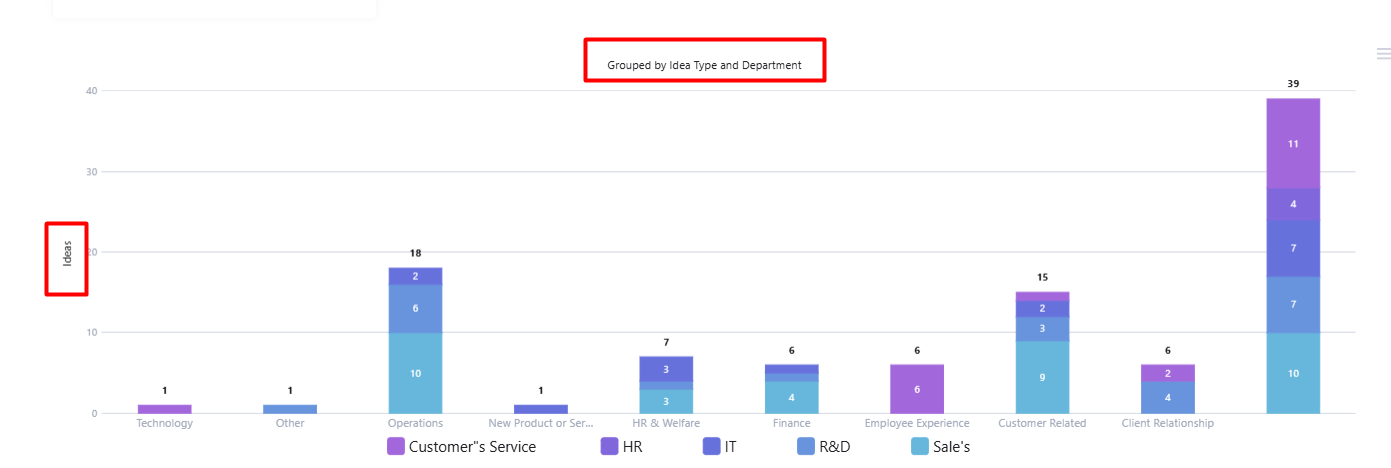
- Double grouping of a single KPI.
- Use "No Grouping" as the first grouping option
This is how it looks when a "Standrad bars" chart is selected: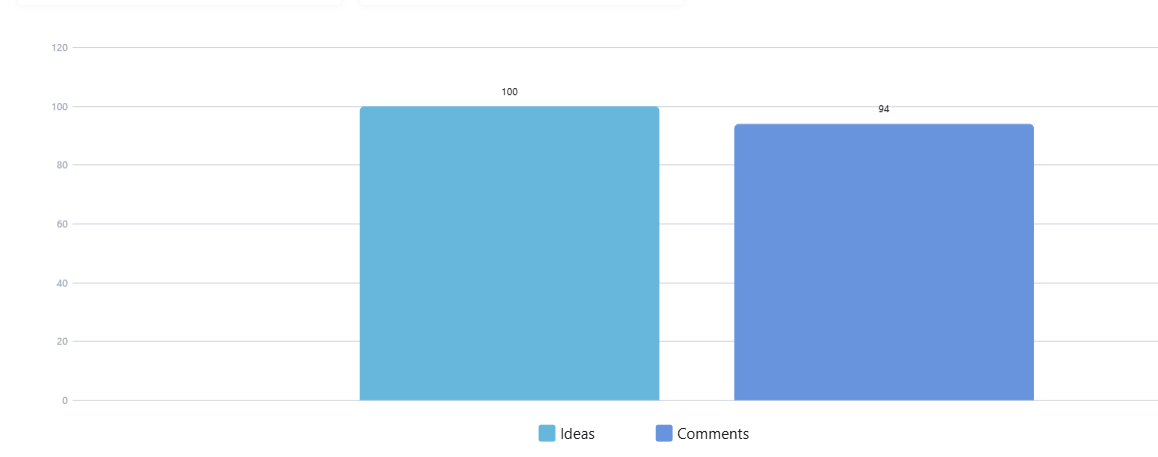
This is how it will look when a single KPI is selected: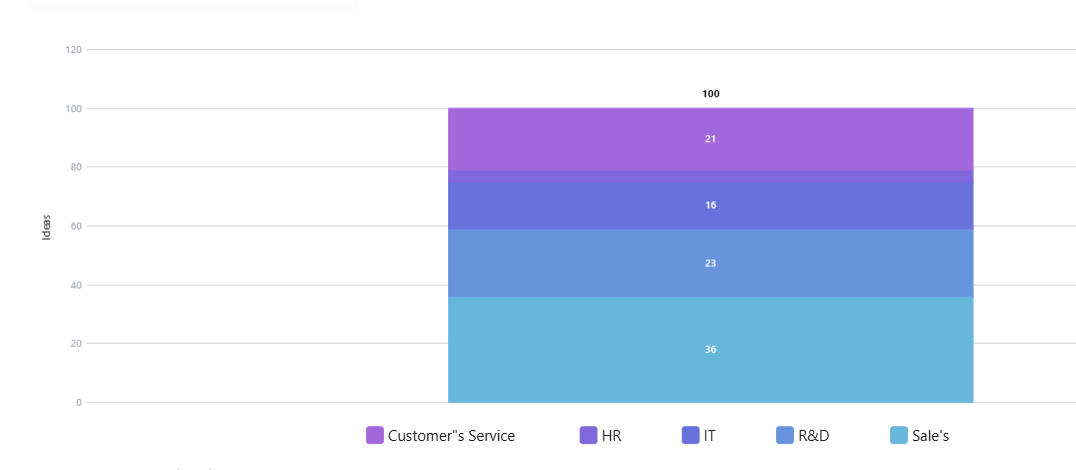
You can display several KPIs side by side within a single report or widget, making it easier to compare metrics and analyze data in one view.