Qmarkets' reports and dashboards can be based on a variety of KPIs as explained in this article.
Since in many cases it is useful to understand exactly how a KPI was calculated, Qmarkets supports drill-down capabilities for both most KPIs allowing you to easily inspect the data behind each metric.
How to Drill Down
You can drill down into a KPI in various ways:
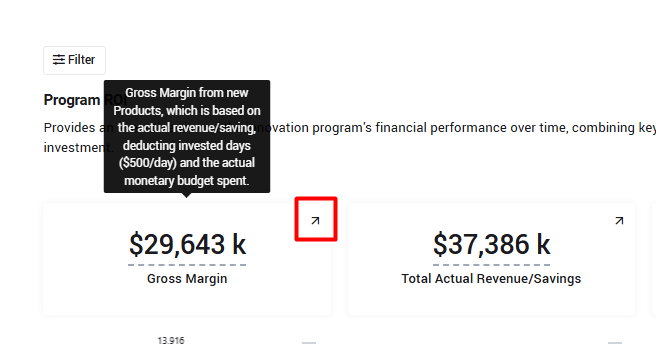
To view the data behind the KPI overall value, click the drill-down arrow next to the KPI:
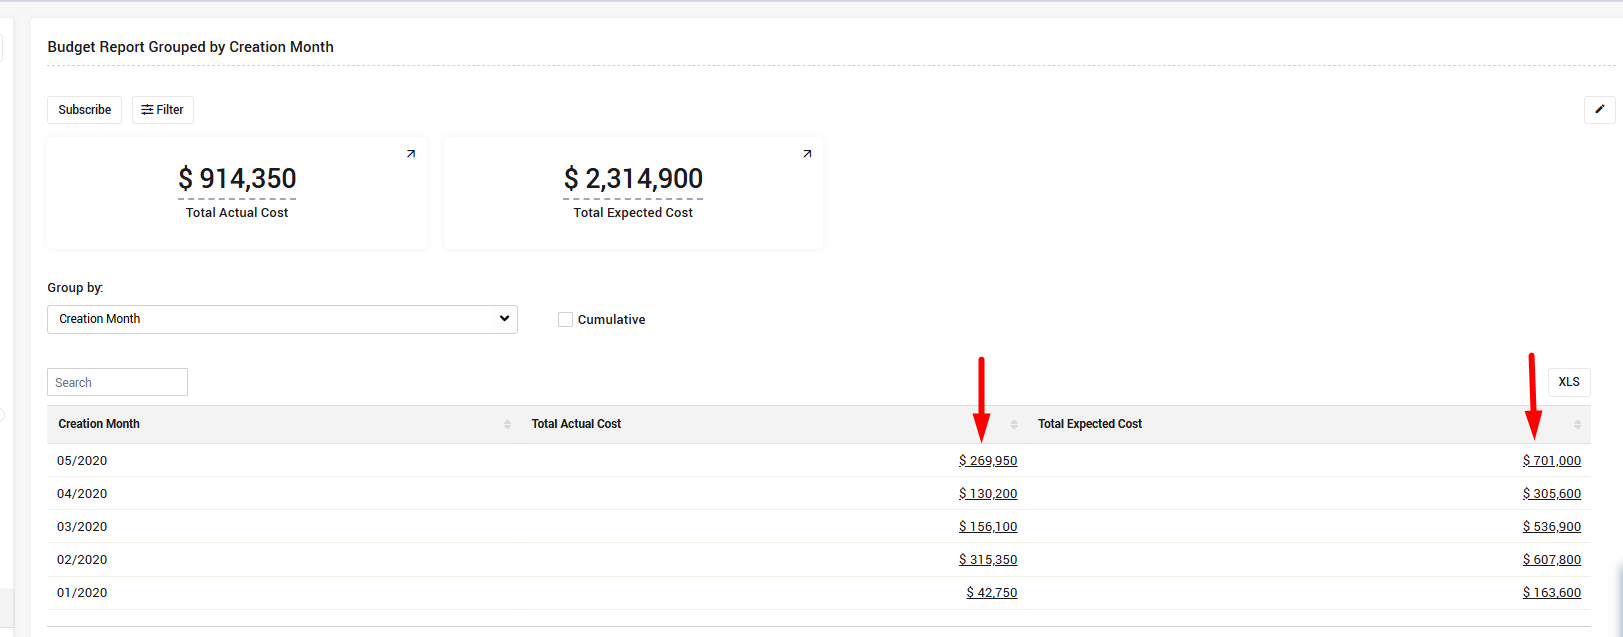
The drill down is also available from inside the tabular reports:
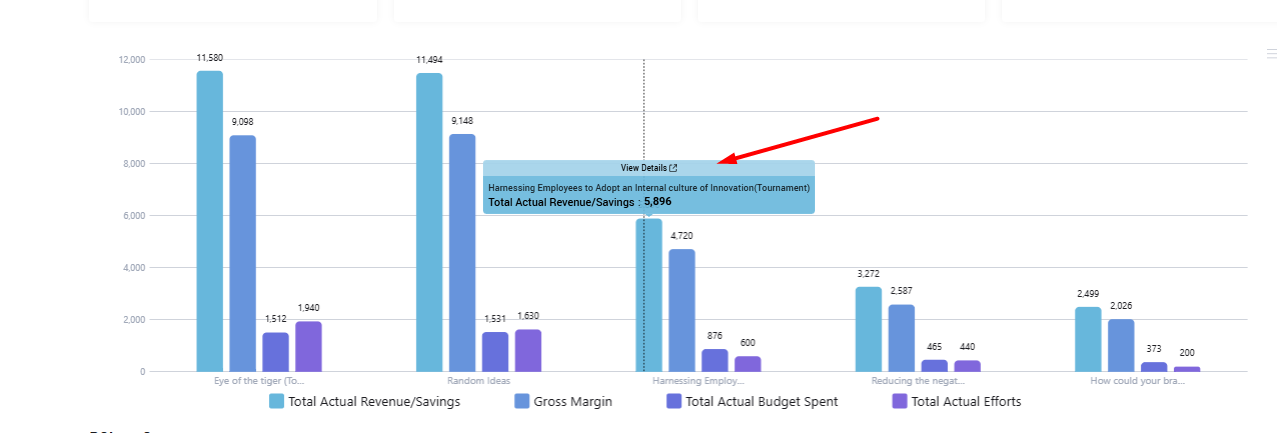
and from the charts:
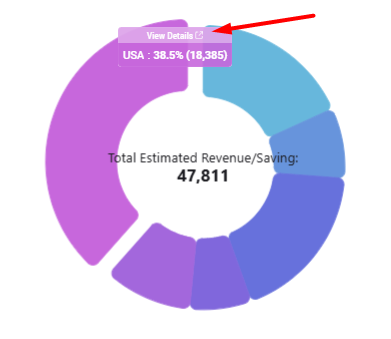
A detailed table will open, displaying the records and relevant values used to calculate the KPI, based on its type.
What data is displayed
Our aim is to display the most relevant set of data based on the KPI type/
For Numeric/Formula KPIs
In case that the KPI is based on a specific numeric field or reflects a formula that is based on several KPIs), the table will include these fields.
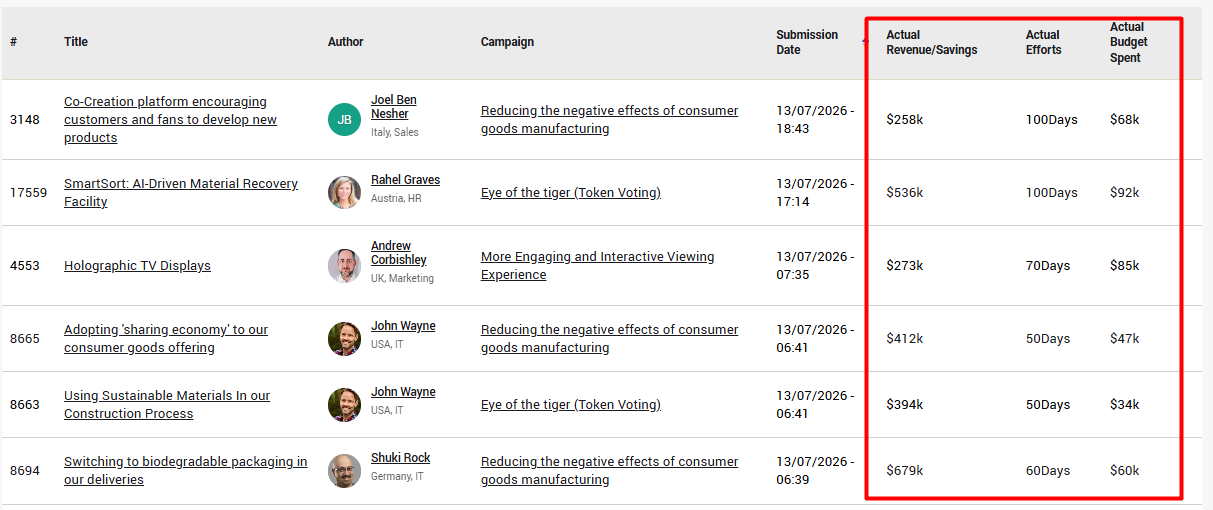
For example, if your dashboard includes a KPI such as Revenue in the Next 3 Years, selecting the drill-down option will display the relevant records and field values used in the calculation.
For Workflow/Transition-based KPIs
This enables you to inspect the records behind workflow metrics and understand how they were calculated.
Examples include: Time to Decision and Ideas Entering Evaluation.
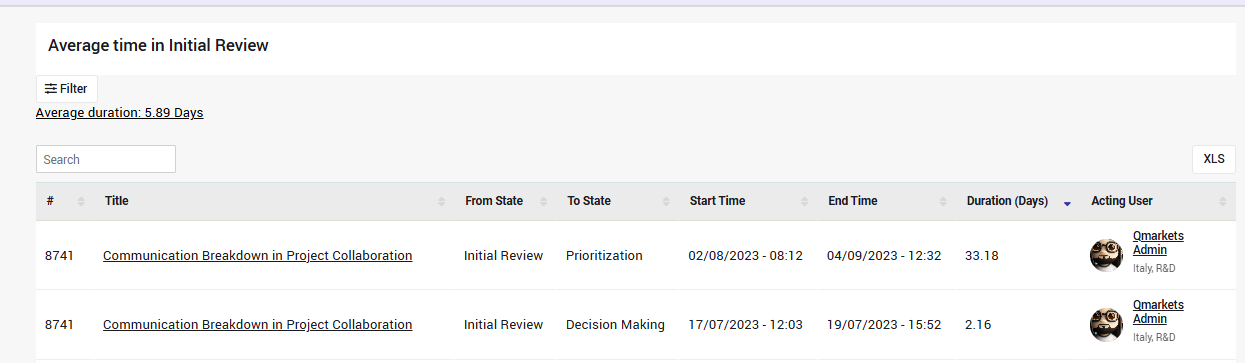
Instead of seeing only the aggregated KPI value, you can drill down to view all the records that contributed to the metric with the relevant information about when the transition was done and by which user.
For example: